
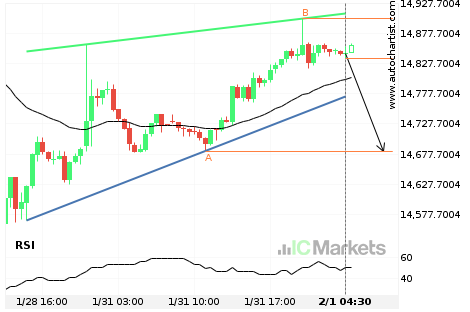
Should we expect a breakout or a rebound on FTSE China A50 Index?
The movement of FTSE China A50 Index towards the support line of a Rising Wedge is yet another test of the line it reached numerous times in the past. This line test could happen in the next 9 hours, but it is uncertain whether it will result in a breakout through this line, or simply […]
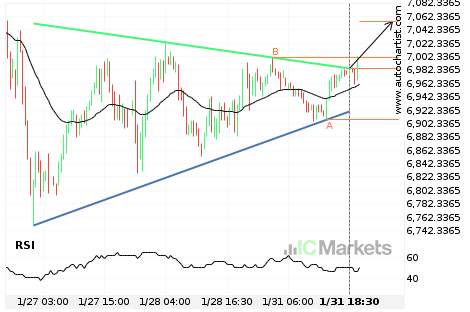
Resistance line breached by Australia 200 Index
Australia 200 Index has broken through the resistance line which it has tested twice in the past. We have seen it retrace from this line before, so one should wait for confirmation of the breakout before trading. If this new trend persists, a target level of around 7055.0110 may materialize within the next 19 hours.
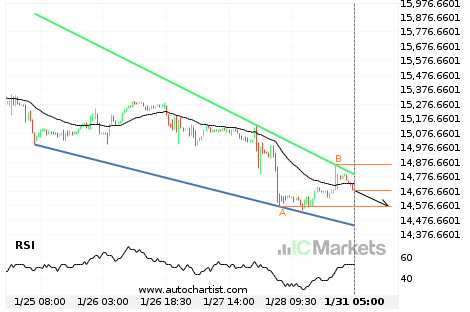
Should we expect a breakout or a rebound on FTSE China A50 Index?
The movement of FTSE China A50 Index towards the support line of a Falling Wedge is yet another test of the line it reached numerous times in the past. This line test could happen in the next 2 days, but it is uncertain whether it will result in a breakout through this line, or simply […]
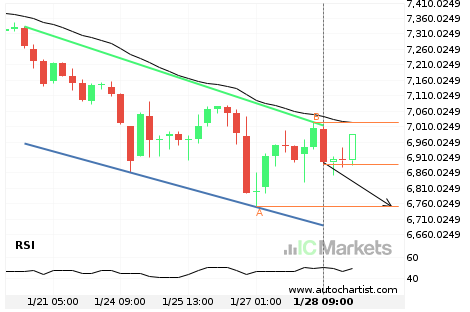
Either a rebound or a breakout imminent on Australia 200 Index
Australia 200 Index is heading towards the support line of a Channel Down. If this movement continues, the price of Australia 200 Index could test 6749.9800 within the next 2 days. It has tested this line numerous times in the past, so this movement could be short-lived and end up rebounding just like it did […]
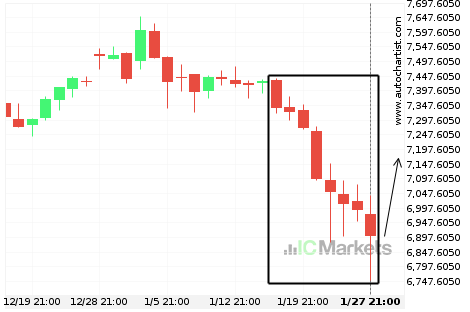
8 consecutive daily bearish candles on Australia 200 Index
Australia 200 Index has moved lower after 8 consecutive daily candles from 7433.3000 to 6899.9800 in the last 11 days.

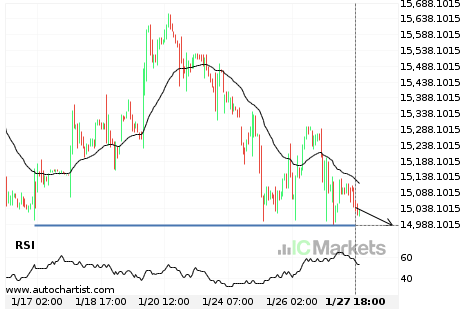
Should we expect a breakout or a rebound on FTSE China A50 Index?
The movement of FTSE China A50 Index towards 14984.9902 price line is yet another test of the line it reached numerous times in the past. We could expect this test to happen in the next 2 days, but it is uncertain whether it will result in a breakout through this line, or simply rebound back […]
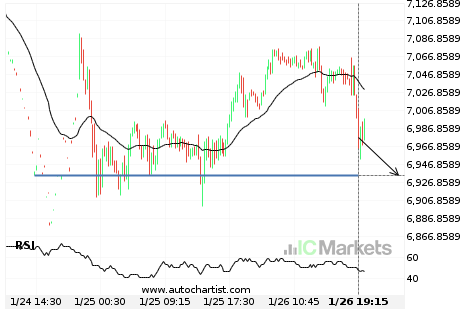
Breach of important price line imminent by Australia 200 Index
Australia 200 Index is moving towards a line of 6934.7202 which it has tested numerous times in the past. We have seen it retrace from this position in the past, so at this stage it isn’t clear whether it will breach this price or rebound as it did before. If Australia 200 Index continues in […]